Unlock e-commerce growth: Track these 15 key metrics to measure your success and drive improvements!
In the fast-paced world of e-commerce, understanding how well your business is performing is crucial for long-term success. Key metrics provide valuable insights into various aspects of your online store, helping you make informed decisions, optimize strategies, and achieve your growth goals. Here’s a comprehensive guide to the 15 essential metrics you should track to measure e-commerce success.
-
Conversion Rate
“Convert visits into sales: The conversion rate reveals how effectively your site turns visitors into customers.”
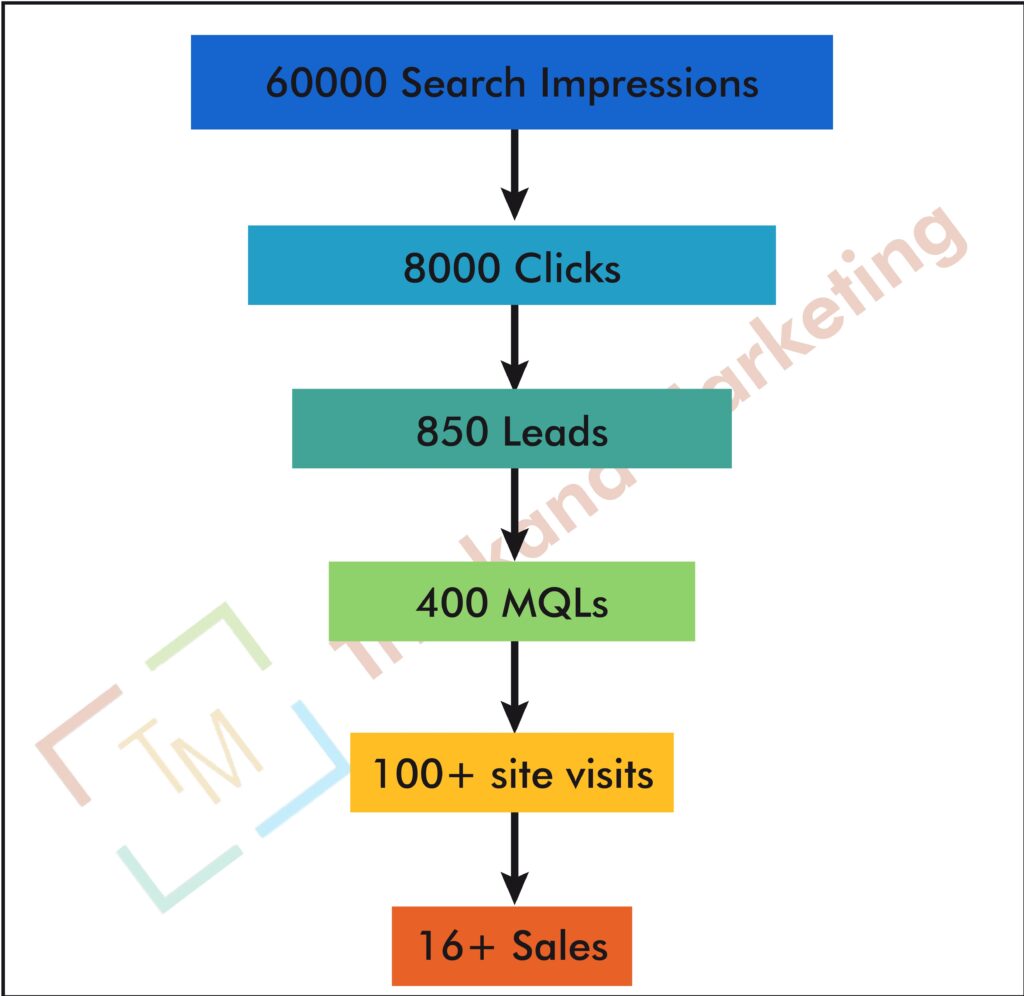
Conversion rate is one of the most critical metrics for e-commerce success. It measures the percentage of visitors who complete a desired action, such as making a purchase. A high conversion rate indicates that your website effectively persuades visitors to buy, while a low rate suggests potential issues with your sales funnel.
How to Calculate:
\[ \text{Conversion Rate} = \left( \frac{\text{Number of Sales}}{\text{Number of Visitors}} \right) \times 100 \]
Why It Matters:
– Identify Issues: A low conversion rate may highlight issues with your website’s design, user experience, or checkout process.
– Optimization Opportunities: Regularly analyzing conversion rates helps identify areas for improvement and test new strategies to boost sales.
-
Average Order Value (AOV)
“Boost revenue per transaction: AOV shows the average amount customers spend per order.”
Average Order Value (AOV) measures the average amount of money each customer spends per transaction. Increasing AOV can significantly impact your overall revenue without needing to attract more customers.
How to Calculate:
\[ \text{Average Order Value} = \frac{\text{Total Revenue}}{\text{Number of Orders}} \]
Why It Matters:
– Revenue Growth: Higher AOV means more revenue per sale, which can improve profitability.
– Sales Strategies: Use AOV data to implement upselling and cross-selling strategies, encouraging customers to spend more.
-
Customer Lifetime Value (CLV)
“Predict long-term value: CLV estimates the total revenue a customer will generate over their lifetime.”
Customer Lifetime Value (CLV) estimates the total revenue a business can expect from a customer over their entire relationship. This metric helps you understand the long-term value of acquiring and retaining customers.
How to Calculate:
\[ \text{Customer Lifetime Value} = \text{Average Purchase Value} \times \text{Purchase Frequency} \times \text{Customer Lifespan} \]
Why It Matters:
– Marketing ROI: CLV helps determine how much you can invest in acquiring and retaining customers.
– Customer Retention: High CLV indicates strong customer loyalty and effective retention strategies.
-
Cart Abandonment Rate
“Address drop-offs: The cart abandonment rate reveals how many customers leave without completing their purchase.”
Cart Abandonment Rate measures the percentage of shoppers who add items to their cart but leave the website without completing the purchase. Understanding and addressing cart abandonment can help improve your conversion rates and overall sales.
How to Calculate:
\[ \text{Cart Abandonment Rate} = \left( \frac{\text{Number of Abandoned Carts}}{\text{Number of Carts Created}} \right) \times 100 \]
Why It Matters:
– Identify Issues: High cart abandonment rates can signal issues with the checkout process, shipping costs, or payment options.
– Optimization Strategies: Implement strategies such as abandoned cart emails, simplified checkout processes, and transparent pricing to reduce abandonment.
-
Bounce Rate
“Engage visitors: Bounce rate shows the percentage of visitors who leave your site after viewing only one page.”
Bounce Rate measures the percentage of visitors who leave your website after viewing only one page, without interacting further. A high bounce rate can indicate that visitors are not finding what they’re looking for or that your site’s content is not engaging.
How to Calculate:
\[ \text{Bounce Rate} = \left( \frac{\text{Single-Page Visits}}{\text{Total Visits}} \right) \times 100 \]
Why It Matters:
– User Experience: A high bounce rate may suggest issues with your site’s usability or content relevance.
– Engagement Opportunities: Analyze bounce rate by page to identify and improve underperforming content and landing pages.
-
Return on Advertising Spend (ROAS)
“Measure ad effectiveness: ROAS assesses the revenue generated for every dollar spent on advertising.”
Return on Advertising Spend (ROAS) measures the effectiveness of your advertising campaigns by calculating the revenue generated for each dollar spent on ads. This metric helps you evaluate the performance of your marketing efforts and optimize your ad budget.
How to Calculate:
\[ \text{Return on Advertising Spend} = \frac{\text{Revenue from Ads}}{\text{Cost of Ads}} \]
Why It Matters:
– Campaign Performance: High ROAS indicates that your advertising campaigns are effective and generating a good return on investment.
– Budget Allocation: Use ROAS data to allocate your advertising budget more efficiently and invest in high-performing channels.
-
Customer Acquisition Cost (CAC)
“Understand your investment: CAC calculates the cost of acquiring a new customer.”
Customer Acquisition Cost (CAC) measures the total cost associated with acquiring a new customer, including marketing and sales expenses. Tracking CAC helps you understand the efficiency of your customer acquisition strategies and optimize your spending.
How to Calculate:
\[ \text{Customer Acquisition Cost} = \frac{\text{Total Acquisition Costs}}{\text{Number of New Customers}} \]
Why It Matters:
– Budget Management: CAC helps you manage your marketing budget and determine the profitability of acquiring new customers.
– Strategic Adjustments: Analyze CAC alongside CLV to ensure that your customer acquisition efforts are sustainable and profitable.
-
Sales Growth
“Track your progress: Sales growth measures the increase in revenue over a specific period.”
Sales Growth measures the percentage increase in revenue over a specific period, such as monthly or yearly. This metric helps you track your business’s financial health and overall growth trajectory.
How to Calculate:
\[ \text{Sales Growth} = \left( \frac{\text{Revenue in Current Period} – \text{Revenue in Previous Period}}{\text{Revenue in Previous Period}} \right) \times 100 \]
Why It Matters:
– Performance Tracking: Sales growth provides a clear picture of your business’s performance and effectiveness of your sales strategies.
– Forecasting: Use sales growth trends to forecast future revenue and plan for scaling your operations.
-
Revenue per Visitor (RPV)
“Maximize visitor value: RPV shows how much revenue you generate per site visitor.”
Revenue per Visitor (RPV) measures the average amount of revenue generated from each visitor to your website. This metric helps you evaluate the effectiveness of your site in converting visitors into revenue.
How to Calculate:
\[ \text{Revenue per Visitor} = \frac{\text{Total Revenue}}{\text{Total Number of Visitors}} \]
Why It Matters:
– Performance Indicator: RPV helps assess the effectiveness of your website’s design, content, and marketing in generating revenue.
– Optimization Opportunities: Analyze RPV to identify areas where you can improve user experience and conversion rates.
-
Customer Retention Rate
“Keep them coming back: Customer retention rate measures your ability to retain customers over time.”
Customer Retention Rate measures the percentage of customers who continue to make purchases from your store over a specific period. High retention rates indicate that you’re successfully engaging and satisfying your customers.
How to Calculate:
\[ \text{Customer Retention Rate} = \left( \frac{\text{Number of Customers at End of Period} – \text{Number of New Customers Acquired}}{\text{Number of Customers at Start of Period}} \right) \times 100 \]
Why It Matters:
– Loyalty Insights: High retention rates signify strong customer loyalty and effective retention strategies.
– Growth Potential: Focusing on retention can be more cost-effective than acquiring new customers and contributes to long-term growth.
-
Product Return Rate
“Manage returns: The product return rate reveals the percentage of products returned by customers.”
Product Return Rate measures the percentage of products that customers return after purchase. A high return rate can indicate issues with product quality, sizing, or descriptions.
How to Calculate:
\[ \text{Product Return Rate} = \left( \frac{\text{Number of Returned Products}}{\text{Total Number of Products Sold}} \right) \times 100 \]
Why It Matters:
– Quality Control: A high return rate may signal problems with product quality or accuracy of product descriptions.
– Customer Satisfaction: Analyzing return rates helps you address issues and improve the overall customer experience.
-
Email Open Rate
“Gauge engagement: Email open rate shows how many recipients open your marketing emails.”
Email Open Rate measures the percentage of recipients who open your marketing emails. This metric indicates how well your subject lines and email content engage your audience.
How to Calculate:
\[ \text{Email Open Rate} = \left( \frac{\text{Number of Emails Opened}}{\text{Number of Emails Sent}} \right) \times 100 \]
Why It Matters:
– Engagement Tracking: High open rates suggest effective email campaigns and strong audience interest.
– Optimization: Use open rate data to test and improve email subject lines, content, and timing.
-
Net Promoter Score (NPS)
“Measure loyalty: NPS assesses customer satisfaction and their likelihood to recommend your business.”
Net Promoter Score (NPS) measures customer satisfaction and their likelihood to recommend your business to others. This metric provides insights into overall customer sentiment and loyalty.
How to Calculate:
Survey customers with the question: “On a scale of 0-10, how likely are you to recommend our company to a friend or colleague?” Calculate the percentage of promoters (9-10) and detractors (0-6), then subtract the percentage of detractors from promoters.
Why It Matters:
– Customer Loyalty: High NPS indicates strong customer satisfaction and loyalty.
– Improvement Areas: Use NPS feedback to identify areas for improvement and enhance customer experiences.
-
Page Load Time
“Speed matters: Page load time affects user experience and conversion rates.”
Page Load Time measures how quickly your website’s pages load. Faster load times improve user experience, reduce bounce rates, and can positively impact conversion rates and SEO.
How to Calculate:
Use tools like Google PageSpeed Insights or GTmetrix to measure the time it takes for your web pages to load fully.
Why It Matters:
– User Experience: Slow page load times can frustrate users and lead to higher bounce rates.
– SEO Impact: Page speed is a factor in search engine rankings, so optimizing load times can improve your site’s visibility.
-
Social Media Engagement Rate
“Connect and engage: Social media engagement rate measures how well your content resonates with your audience.”
Social Media Engagement Rate measures the level of interaction your content receives on social media platforms, including likes, comments, shares, and clicks. This metric helps evaluate the effectiveness of your social media strategy and content.
How to Calculate:
\[ \text{Social Media Engagement Rate} = \left( \frac{\text{Total Engagements}}{\text{Total Impressions}} \right) \times 100 \]
Why It Matters:
– Content Effectiveness: High engagement rates indicate that your content is resonating with your audience.
– Strategy Optimization: Use engagement data to refine your social media strategy, improve content quality, and increase audience interaction.
By tracking and analyzing these 15 key metrics, you can gain a comprehensive understanding of your e-commerce business’s performance. Each metric provides valuable insights that can help you optimize strategies, improve customer experiences, and drive sustainable growth. Stay proactive in monitoring these metrics and make data-driven decisions to achieve your e-commerce success.